Age group × income level: population share heatmap
Share of the age group (%)
Population share by income level over time
Pick an age group to see how its population is distributed across income levels in each year (%)
Data notes and definitions
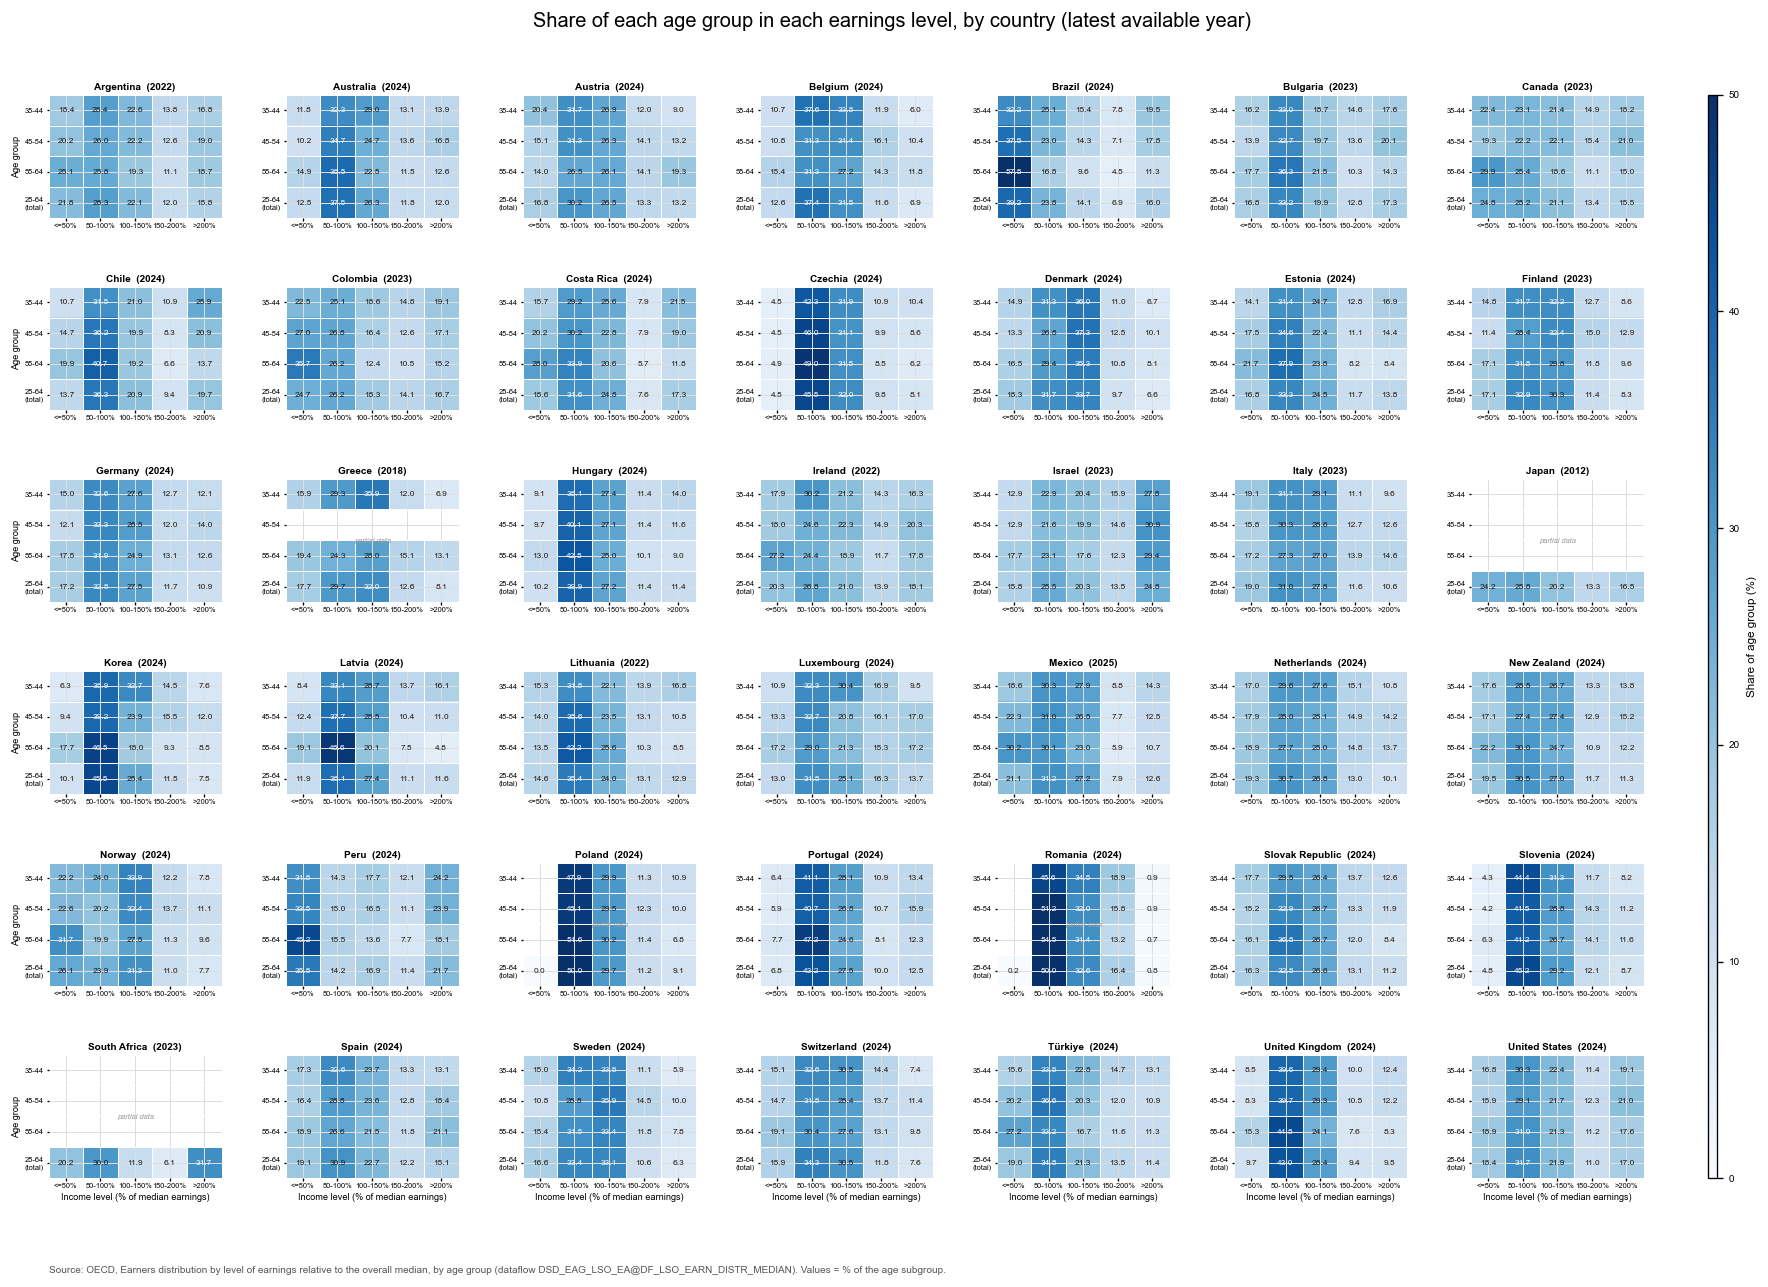
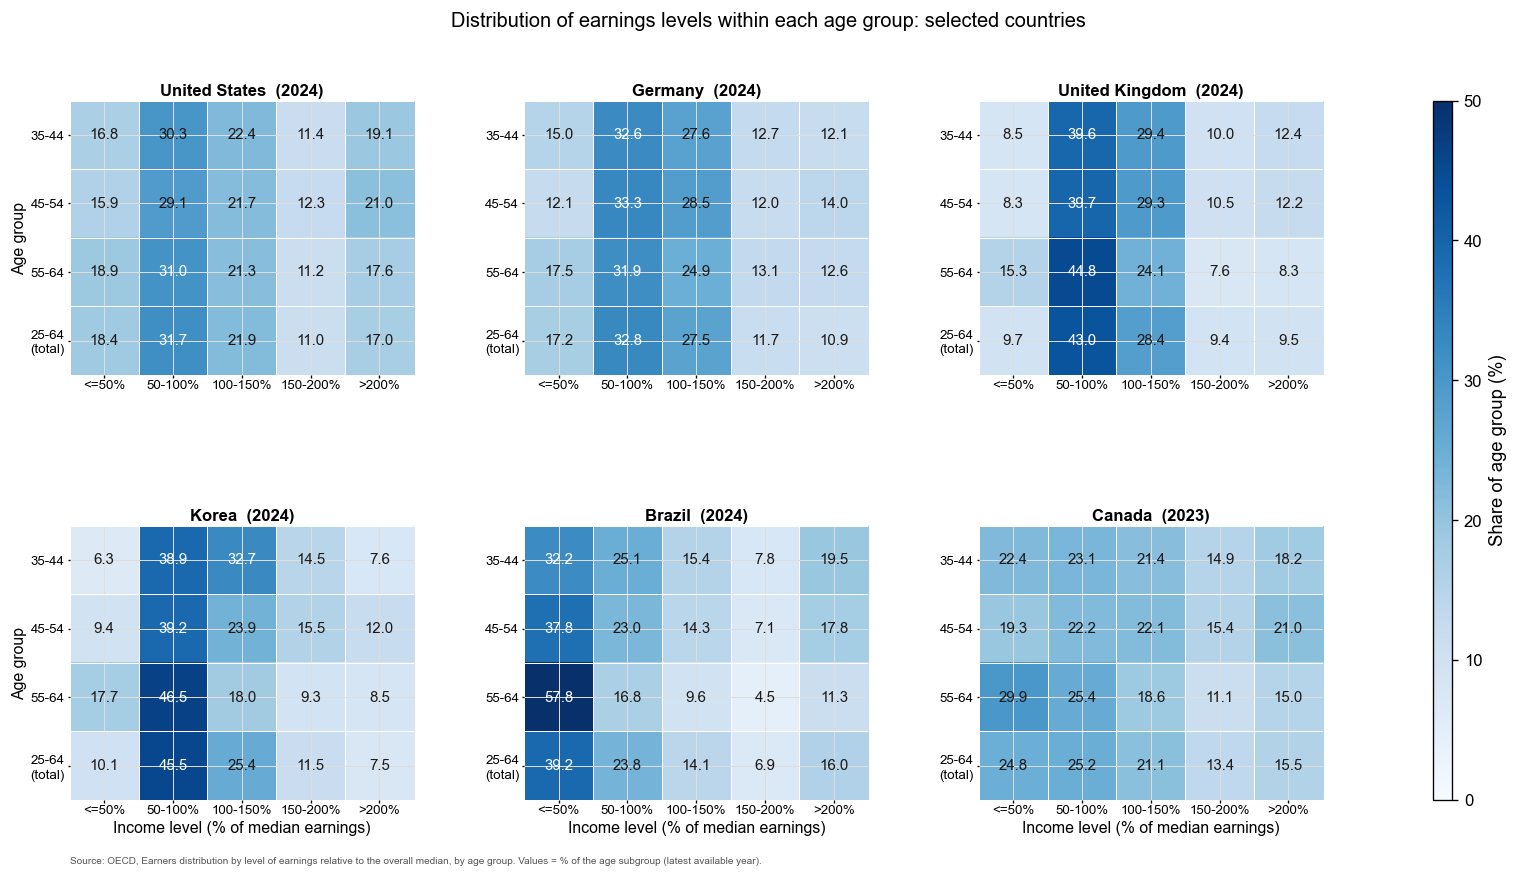
- Dataset A (default, widest coverage): OECD Earners distribution based on their level of earnings relative to the overall median, by age group, dataflow
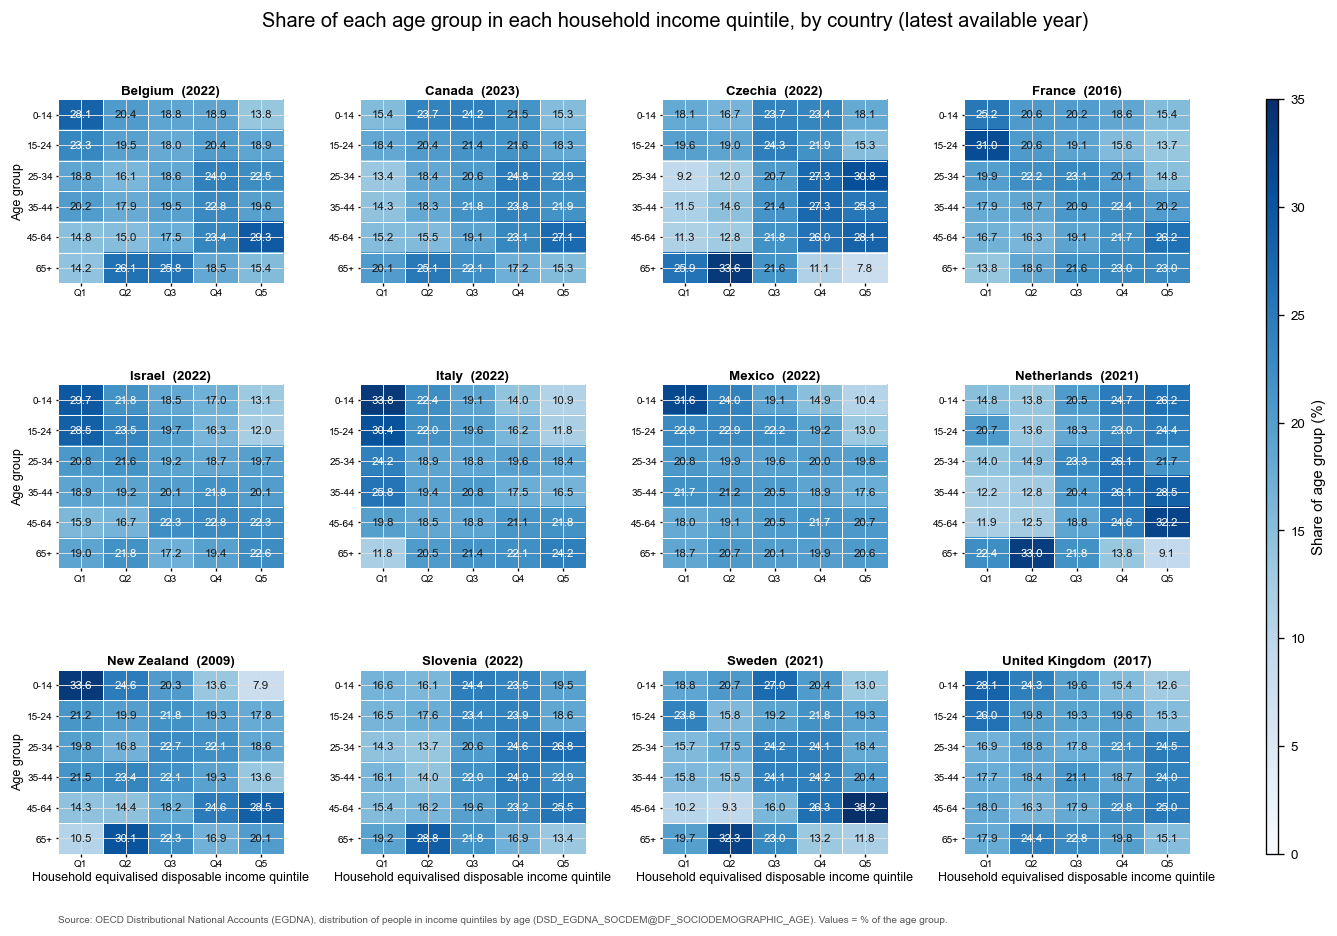
OECD.EDU.IMEP:DSD_EAG_LSO_EA@DF_LSO_EARN_DISTR_MEDIAN(1.0). The population is earners with income. Income level = individual earnings divided by the overall median, in 5 bands: ≤50%, 50-100%, 100-150%, 150-200%, >200%. Ages cover 25-64 only; the 25-64 row is a total that overlaps the 35-44 / 45-54 / 55-64 rows, so use only one of the two breakdowns at a time. - Dataset B: OECD Population in the National Accounts: distribution of people in income quintiles by age, dataflow
OECD.SDD.NAD:DSD_EGDNA_SOCDEM@DF_SOCIODEMOGRAPHIC_AGE(1.0)(Distributional National Accounts / EGDNA). The population is the whole population, children and older people included. Income level = quintile of household equivalised disposable income, Q1…Q5. - Why two datasets: A covers 42 countries but only the working-age population and uses individual earnings; B covers all ages but only 12 countries and uses household income. The two are not directly comparable — switch datasets and read them separately.
- How to read the heatmap: each row is an age group, each column an income level, and the cell value is the percentage of that age group's population falling into that income level. Rows sum to 100% (dataset B can be switched to a columns-sum-to-100% basis). Darker blue means a larger share.
- Missing data: the United States is flagged NA by the OECD in dataset B (not published), so B excludes the US. For some countries the age breakdown exists only in certain years (for example Japan ends in 2012 in dataset A); the chart automatically shows the years that are available.
- Source and reproduction: every number on this page comes from the OECD SDMX API (
sdmx.oecd.org). The companion workbookincome_by_age_country_distribution.xlsxholds the full long and matrix tables.
Static overview charts
High-resolution figures stored alongside this file (120 dpi)