
Issues in 10.3389/fpls.2025.1633654
Several issues are identified in the article [1]:
Discrepancy between the data in the Table 2 and Table 3 of this article. (1) The stability area should be smaller than the suitable area at both the beginning and the end of the period; however, the data in Tables 2 and 3 do not meet this requirement. For example, under the SSP126 scenario, the stability area between the current period (1970-2000) and the future period (2041-2060) is reported in Table 2 as 525,199.03 km2, which is larger than the current suitable area (481,081.40 km2) reported in Table 3. (2) The expansion area minus the contraction area should equal the change in suitable area from the beginning to the end of the period; however, the data in Tables 2 and 3 do not meet this requirement. For example, under the SSP126 scenario, the suitable area for the current period (1970-2000) is reported as 481,081.40 km2, while the suitable area for the future period is reported as 707,529.71 km2. The resulting change in suitable area is 226,448.31 km2, which is smaller than the expansion area (242,771.84 km2) minus the contraction area (557.46 km2), i.e., 242,214.38 km2.
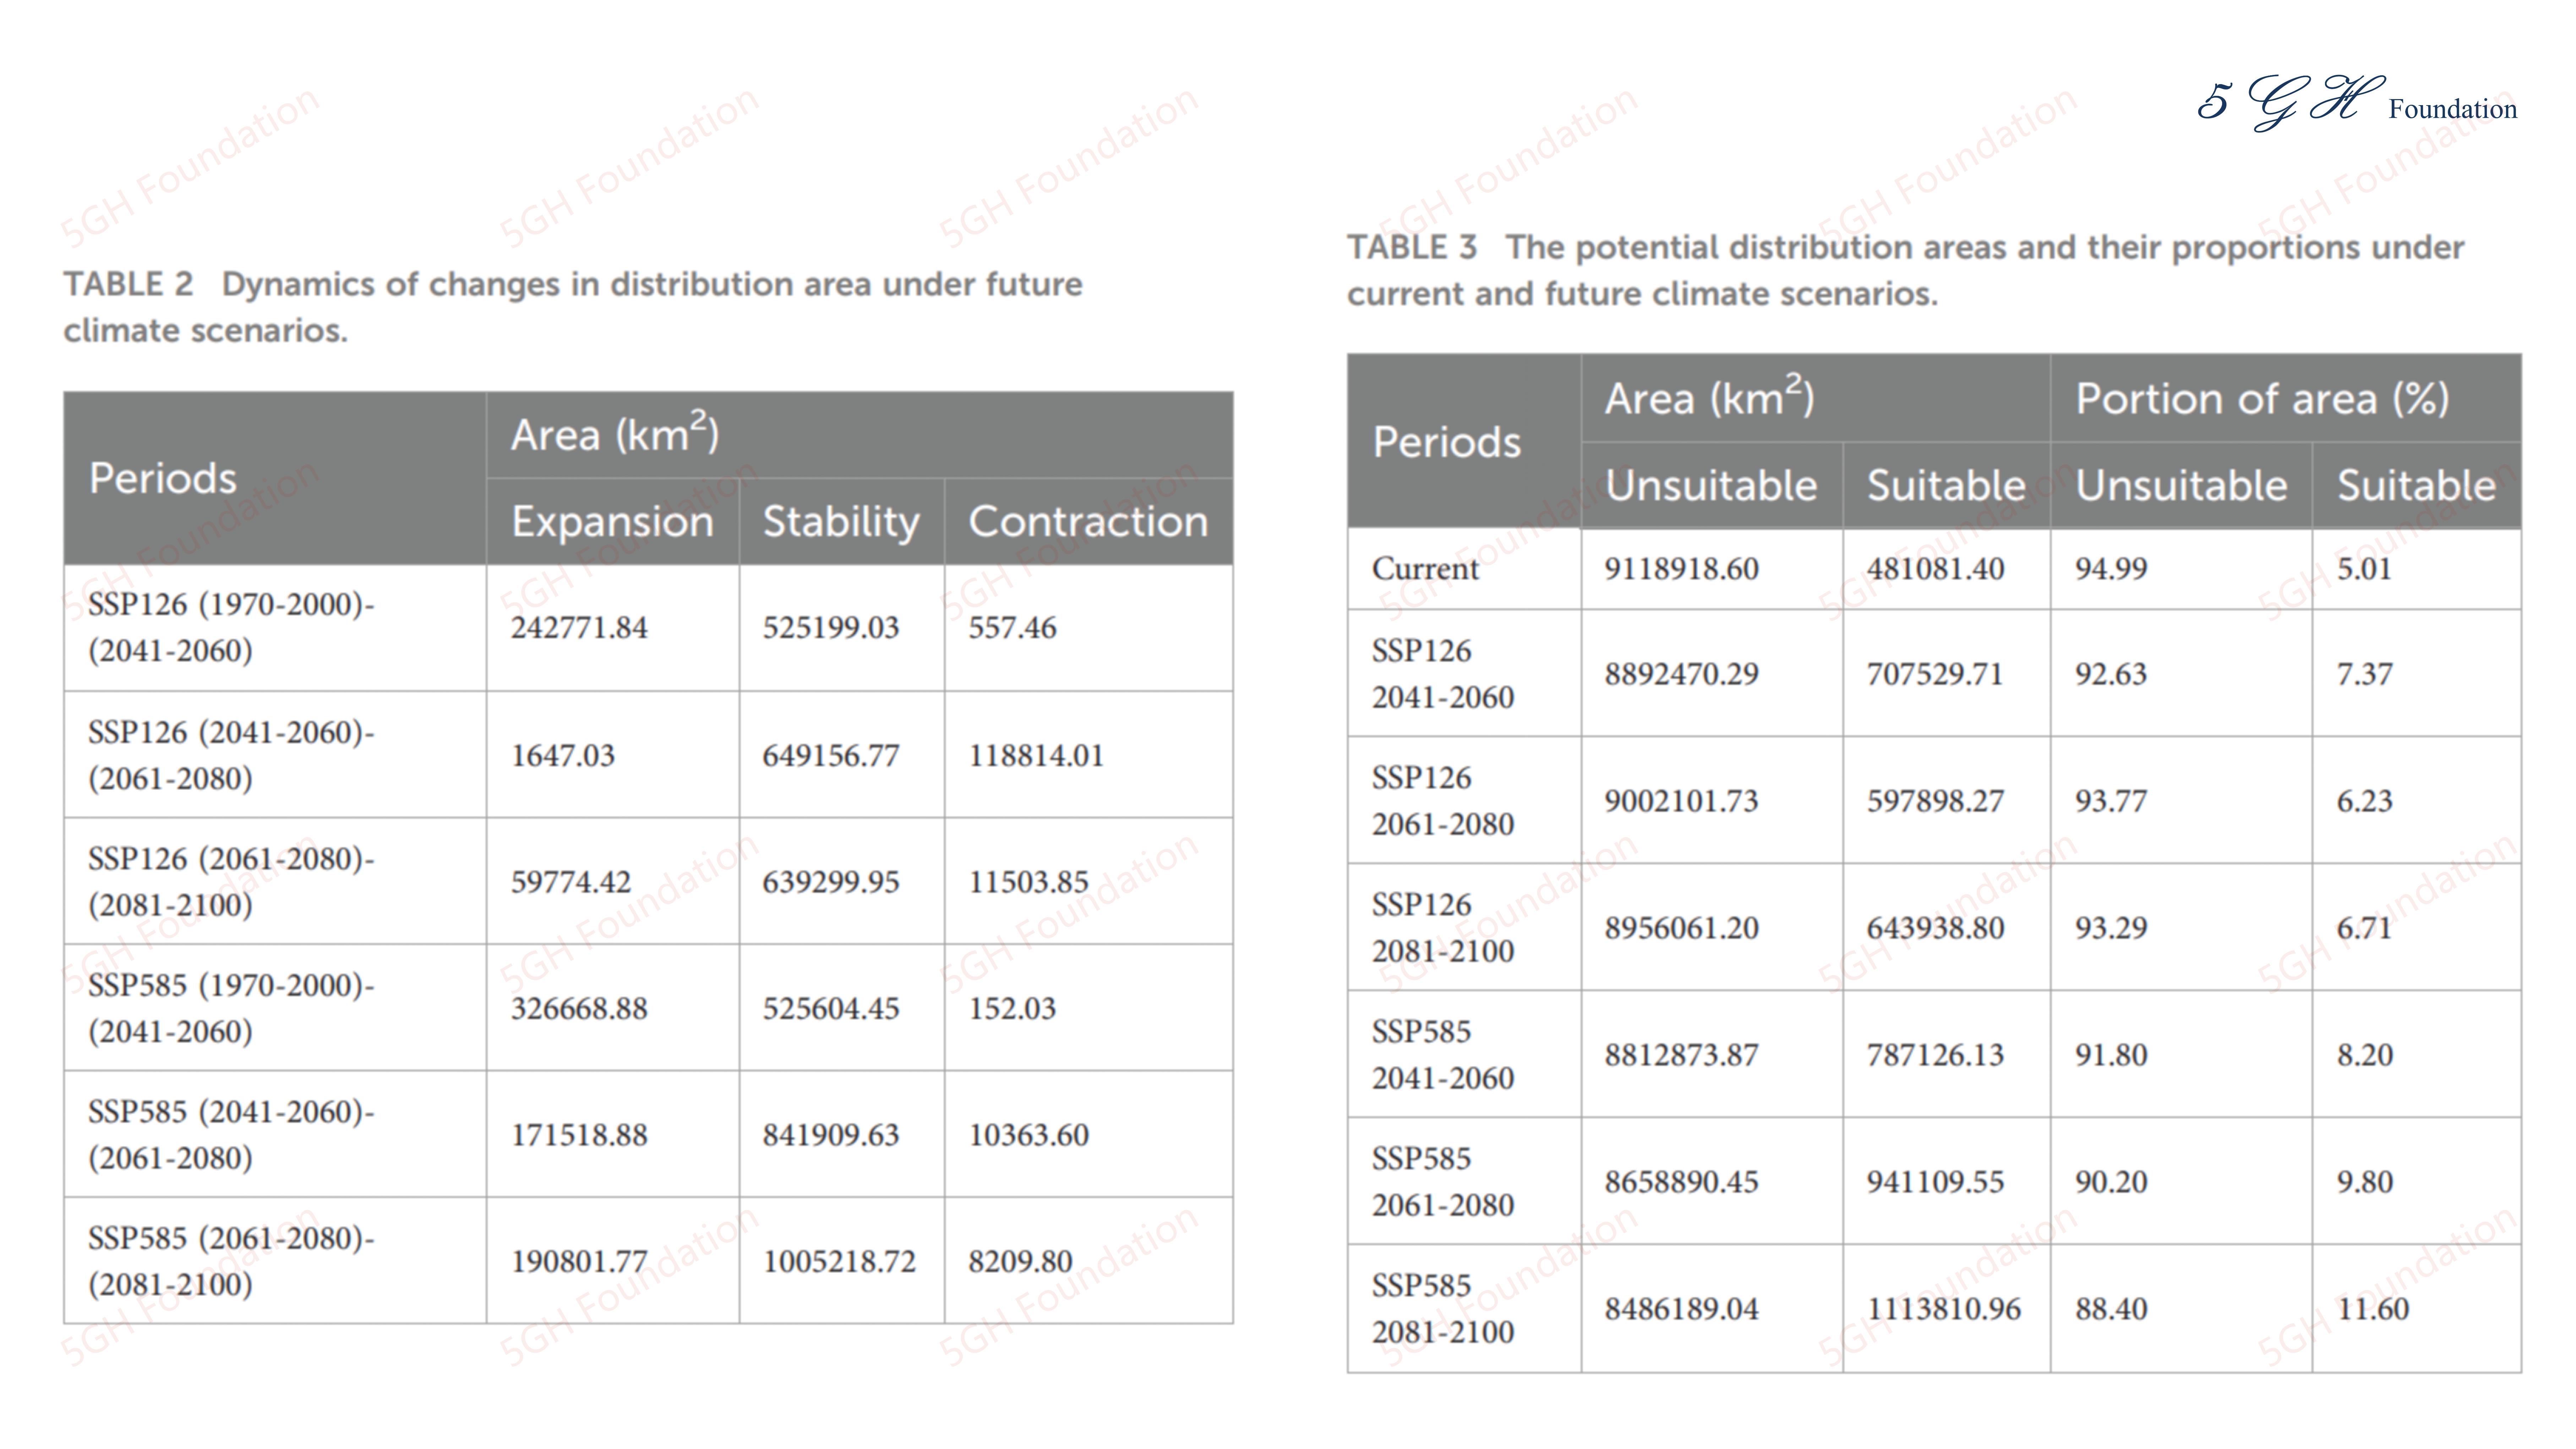
More ever, this article [1] contains some inconsistencies. (1) In section 2.2, the article states that "Digital Elevation Model (250 m) from the Geospatial Data Cloud" was used in their study; however, in "Data availability statement" section, the article states that "the altitude, slope, and aspect were extracted from the Digital Elevation Model (25 m), which was obtained from the Geospatial Data Cloud". (2) In section 2.2, the article states that " land cover indices (30'') from the Global Map data archives" was used in their study; however, in "Data availability statement" section, the article states that "the indices of land cover (15 sec) were obtained from the Global Map data archives". (3) In section 2.3, the article states that "in all, 1240 candidate models, with parameters reflecting all combinations of 40 RM settings (from 0.1 to 4 with the interval of 0.1) and 29 FC combinations, have been evaluated"; however, 40 times 29 should be 1160 (models), not 1240 models.
The DOI provided for the reference Phillips, S. J., and Dudík, M. (2008) is incorrect. The incorrect DOI is 10.1111/j.2007.0906-7590.05203.x; the correct DOI is 10.1111/j.0906-7590.2008.5203.x.
The reference Yi et al., 2021 cited in the statement "to assess model performance, we used the area under the ROC curve (AUC), true skill statistic (TSS), and KAPPA (Yi et al., 2021; Zhao et al., 2021; Allouche et al., 2006)" is not listed in the reference section.
Reference